
Air quality
This article provides analysis of air quality from three data sources: These relate to emissions of pollutants, background concentrations of pollutants and the degree to which air pollution affects quality of life as determined by the 2025 Indices of Deprivation.
Summary of emissions data per sq km for nitrogen oxides, particulates and sulphur dioxide
We have analysed the local 2024 emissions data per square kilometre for nitrogen oxides, particulates and sulphur dioxide. These have been sourced from the National Atmospheric Emissions Inventory. Nitrogen oxides are greenhouse gases that contribute to acid rain, depletion of the ozone layer and have detrimental effects on health. High emission levels in the county are associated with urban areas and the main road networks. Particularly high local area emissions are not surprisingly found at locations of major industrial activity in the county.
It is important to note that high levels of local emissions cannot be directly equated with local air quality at ground level. The height of an industrial chimney will be specifically regulated for the industrial processes being carried out, and the emissions will be dispersed away from the plant depending on meteorological conditions. Emissions from traffic tend to have a more direct impact on air quality at ground level.
Particulate matter refers to tiny particles suspended in the air. They include not only smoke and dust particles, but also mould and other spores and pollen. Particulates may affect the heart and lungs, and are often seen as one of the most critical of pollutants as a result of their impact on human health.
We have analysed the separate sources of emissions from 3 sectors, and looked in particular at the road transport data. We have also calculated total and average emission values for all 14 Lancashire authorities, together with the percentage of NOx and particulate emissions attributable to road transport sources. This is displayed in the Microsoft Power BI slide below (which can be expanded to full-screen by clicking the double-headed diagonal arrow on the right of the grey footer bar) and is available as a Microsoft Excel download at the foot of the page. The results are displayed in the Power BI report which has been extended to 5 slides. We have not provided any static maps this time, but the accordion (dropdown content) provides some background information.
The key findings are:
Heidelberg Materials (formerly Hanson Cement) near Clitheroe in Ribble Valley was identified as the source of 646 tonnes of NOx, 258 tonnes of sulphur dioxide and 27.5 tonnes of particulate matter.
In Hyndburn 171 tonnes of NOx, 21.6 tonnes of SO2 and 11 tonnes of particulate matter were generated from industrial sources
In West Lancashire 155 tonnes of NOx and 33.3 tonnes of SO2 were generated from industrial sources
The motorways in Chorley district were sources for 325 tonnes of NOx.
The motorways in Lancaster district were sources for 188.5 tonnes of NOx .
The motorways in South Ribble were sources for 120 tonnes of NOx .
The motorways in Preston were sources for 205.4 tonnes of NOx .
Heysham Port was the source of 130 tonnes of NOx
Chemical and waste processing works on the Wyre estuary produced 40 tonnes of NOx
Concentrations of air pollution (Defra data)
An additional source, providing a complementary indication to emissions of pollution, is the Department for Environment, Food and Rural Affairs UK Ambient Air Quality Interactive Map, which shows some of the most common pollutants which are also seen in the NAEI emissions maps but as average concentrations rather than tonnage emitted. Concentrations are given in micrograms per cubic metre of air (µgm-3 or µg/m3). Each pollutant is shown in background or roadside concentrations. For the latter you can select a road section for which a variety of pollutant values will be displayed. This data is available for years up to 2024. Urban area and local authority boundaries can be overlaid in this facility as can the Air Quality Management Area boundaries in which Nitrogen dioxide is monitored - see the accompanying Lancashire Insight article on air quality monitoring. We are now including a new Microsoft Power BI report showing just the Lancashire-14 results. If you view this on a device with a pointer it will show the background concentration for all grid squares along with the UK minimum and maximum values and the World Health Organization recommended level as a target.
Key points for Lancashire-14
The average district concentrations of NOx in all Lancashire districts were all below the WHO recommended limit of 10 µgm-3.
Lancaster had the lowest average concentration of NOx at 3.82 µgm-3
All districts except Lancaster had average concentrations of PM2.5s that exceed the WHO recommended limit of 5 µgm-3.
Nowhere in Lancashire was the WHO limit for SO2 exceeded.
Nowhere in Lancashire was the official legal limit for any of the three pollutants exceeded, either at district or km2 level.
There were 16 sites spread across 8 districts where annual roadside concentrations exceeded 20 µgm-3 of NO2..
The highest roadside concentration in Lancashire was at Walton Summit in South Ribble beside the M6 but near its intersection with the M61.
| Limits | PM2.5 | NO² | SO² |
|---|---|---|---|
| WHO recommended level | 5 | 10 | 40 |
| EU/UK official limit | 20 | 40 |
The second page of the report shows the roadside concentrations on a map and in a table. By selecting a road link in the table the map will zoom and pan to that link. The roadside concentration data is for a limited selection of road links in urban areas. The three pollutants we are showing are PM2.5, PM10 (particulate matter) and NO2. There are 16 sites in Lancashire that had concentrations of NO2 above 20 µgm-3, shared between Burnley and Preston (3 each), and South Ribble, Rossendale, Chorley and Lancaster (2 each) and Pendle and Blackpool (1 each), the highest being 26.35 µgm-3. Seven sites with this high concentration of NO2 are beside the A6. The highest roadside concentration in Lancashire was at Walton Summit in South Ribble beside the M6 but near its intersection with the M61. Major roads which convey heavy goods vehicles and have steeper gradients tend to be most polluted. There is some disparity in how many sites are monitored by location as across Blackburn with Darwen there were 30 sites in total, but in South Ribble and Fylde there were only 3 each.
Sulphur dioxide is not a component of road traffic pollution. It is not considered hazardous to health in small quantities and is added to some foodstuffs as a preservative. The highest concentrations of NO2 and PM2.5s were in Inner London where road traffic is heaviest but the highest concentrations of SO2 were in Northern England and are associated with industrial combustion. A major natural source of SO2 is volcanic activity. On May 31st 2024 a plume of volcanic gases which had originated in Iceland caused a spike of 1,161 µgm-3 of SO2 to be recorded in Edinburgh. Even this amount is not considered hazardous for indoor working. This event did not have much impact on the annual average for 2024 in any part of the UK although a small area near Grangemouth had an annual average in excess of 6 µgm-3.
Summary of air quality results from the 2025 indices of deprivation
A combined indicator of air quality for small local areas was developed as part of the English Indices of Deprivation and the results are available for the 945 lower super output area level (LSOAs) in the Lancashire-14 area. The air quality indicator is now one of six indicators that contribute to the Living Environment Deprivation Domain. Four pollutants are included: NO2, SO2, particulates and benzene. For 2025 estimates of background pollution are compared to World Health Organization guidelines. As a consequence the results are more similar to the section above on background concentrations than for previous indices. Many urban areas in Lancashire suffer to some degree from poorer air quality than other parts of the county though it is much less of an issue in the coastal towns.
The highest recorded score in Lancashire (3.03), is considerably less than the worst level recorded in the country (5.72). Most of the higher scores are from areas within London.
Of the 12 LSOAs with the highest air quality indicator scores (above 2.84) in the Lancashire-14 area, two in West Lancashire have scores exceeding 3. These are in the Digmoor area and border the M58 motorway. The next highest (2.91) is in Preston, an area covering Red Scar and straddling the M6 motorway. The fourth highest at 2.89 is an LSOA that adjoins the first two in West Lancashire, enclosed by the M58, junction 5 on the M58 and the A577. The next 8 cover the west and south east of Chorley town centre. This pattern is entirely different from what was seen in 2019. There are 29 LSOAs with air quality indicator scores below 1.58 in Lancaster, Ribble Valley, Wyre and Pendle. They cover much of the northern part of the county, but not the Lancaster and Morecambe urban area. Those with the best scores, 1.25 or 1.29, are large LSOAs in the rural north-east of the county.
Overview
This article considers a selection of the available emission results for the Lancashire-14 area. This encompasses the 12-districts that are within the Lancashire County Council area, and the two unitary authorities of Blackburn with Darwen and Blackpool.
Background information
The national atmospheric emissions inventory (NAEI) has been estimating annual emissions since 1970. The organisation collects and analyses information from a wide range of data sources that include national energy statistics and results for individual plants. The NAEI website has a number of national emission maps that cover a wide variety of pollutants. The maps reveal how the Lancashire area compares with other parts of the country. The NAEI website also contains details and trend information on the various forms of air pollutants.
From the NAEI website, we have downloaded the 2024 emissions data per square kilometre for nitrogen oxides, particulates and sulphur dioxide. These are three important pollutants with high emission levels. In comparison, a number of UK maps for the other pollutants record very low emission levels.
Emissions of each pollutant are separated into 11 sectors classified by source according to CORINAIR guidelines. These are
· Combustion in energy production and transformation
· Combustion in commercial, institutional, residential and agriculture
· Combustion in industry
· Production processes
· Extraction and distribution of fossil fuels
· Solvent use
· Road transport
· Other transport and mobile machinery
· Waste treatment and disposal
· Agriculture, forestry and landuse change
· Nature
In addition the grid data is supplied as total area emissions and total values including point source emissions for each pollutant. The point sources are the biggest emitters of various pollutants, especially NOx and SO2. These are mostly power stations, steelworks, cement works and other large industrial operations. We have analysed the three main components, road transport, other transport and industrial combustion, for two pollutants, NOx and PM2.5 s, but just industrial combustion for SO2.
Nitrogen oxides
The term nitrogen oxides (NOx) refers to two gases – nitric oxide (NO), and nitrogen dioxide (NO2). Nitrogen oxides contribute to acid rain by mixing with water particles to form nitric acid, to the depletion of the ozone layer and have detrimental effects on health. They are also greenhouse gases. High emission levels in the county are associated with urban areas and the main road networks. Nitrogen oxides are generated by many types of combustion, irrespective of which fuel is being combusted, because 78% of atmospheric gases are nitrogen. DeFRA provide a time-series graph showing the reduction, around 80%, in emissions of this pollutant dating as far back as 1990. The total emissions of NOx in the Lancashire-12 area fell by -15.9% to 8,538 tonnes from 2022 to 2024, if our calculations are correct. In the wider Lancashire-14 area the fall was possibly greater at -17.7%.
Particulate matter (PM2.5)
Particulate matter refers to tiny particles suspended in the air, these are in the mid-range for size of particulates monitored, being less than 2.5 µm in size, and come from transport, industrial, agricultural and mining operations and can be difficult to control. They include not only smoke and dust particles, but also mould and other spores and pollen. Particulates can stick to the surfaces of buildings resulting in blackening of the facades. They can also settle on plants and damage leaves, and for humans they may affect the heart and lungs. Particulates are often seen as one of the most critical of pollutants as a result of their impact on human health, but do not contribute towards acid rain. DeFRA provide a time-series graph showing the reduction in emissions of this pollutant dating as far back as 1990. Emissions of particulates fell by -31.4% between 2022 and 2024 in the Lancashire-12 area and by -33% in the Lancashire-14 area.
Sulphur dioxide
Sulphur dioxide is associated with the combustion of fossil fuels, particularly coal. When most of the country's power stations ran on coal, the output of SO2 was enormous. In the UK in 1979 the energy and transformation sector was responsible for the generation of 3.475 megatonnes of SO2. By 2024 this had fallen to 27.8 kilotonnes. The use of coal in energy production has all but been phased out in the UK. SO2 mixes with chemicals in the air to form sulphuric acid, which falls in acid rain and is damaging to vegetation, forestry and agriculture. Transport is only a very minor source of SO2, but industrial processes such as those at iron and cement works are major sources.
The Gothenburg Protocol
The Gothenburg Protocol, or the 1999 Protocol to Abate Acidification, Eutrophication and Ground-level Ozone (as amended in 2012) — forms part of the 1979 UNECE Convention on Long-Range Transboundary Air Pollution (CLRTAP) which aims to protect humans from air pollution. The Convention came about after widespread publicity of studies into the effects of acid rain in the Northern Hemisphere in the 1960s and 70s. The Protocol was signed by 31 parties and has since been ratified by 26, including the EU, other European nations and the USA. The EU also issued a directive: the National Emissions Ceilings Directive (NECD) which excluded certain agricultural emissions, hence setting a lower ceiling for that pollutant. The Protocol originally covered four main pollutants: sulphur dioxide, nitrogen oxides, volatile organic compounds and ammonia, but was amended to include 'dust' or particulates. The protocol does not cover emissions from sea shipping, the volume of which continues to increase. Targets for reduction were set for 2010, and further targets have been set for future dates of which the latest extends to 2029. The ceilings do not change annually, they remain fixed until 2029. For SO2 the ceiling is a 59% reduction on 2005 levels, for NOx the ceilings reflect a 55% reduction on 2005 levels for both the CLRTAP and NECD standards and for PM2.5s the reduction is 30%. In 2024 the UK achieved the targets for all three of these pollutants.
Air quality management areas
If a local authority finds an air quality issue in a particular locality, it must declare an air quality management area (AQMA) that could be just one or two streets, or cover a much larger locality. The authority will then put together a plan to improve the air quality. Around the UK some AQMAs monitor NO2, SO2 and / or particulates, but in Lancashire only NO2 is monitored.
Analysis of sectors and major point sources
Road transport.
Across the whole Lancashire-14 area, emissions of NOx from road transport sources stood at 3,772 tonnes, lower than previous years. The emission of particulates from road transport sources fell, from 252 tonnes in 2022 to 246 in 2024. We have now provided more detailed tables and graphics in our Microsoft Power BI interactive report. Table 1 below also gives an indication of the volume of traffic on the roads in 2024.
Table 1, vehicle kilometres and daily flow of traffic, 2024
| Millions of vehicle kilometres | Vehicles | |||
| Cars | Vans and HGVs | Trunk roads | All roads | Annual average daily flow* |
Blackburn with Darwen | 580 | 131 | 211 | 717 | 3,634 |
Blackpool | 453 | 77 | 2 | 537 | 3,275 |
Lancashire-12 | 9,129 | 2,558 | 4,519 | 11,799 | 4,497 |
Lancashire-14 | 10,162 | 2,766 | 4,731 | 13,054 | 4,374 |
Source: Department for Transport, road traffic statistics, Traffic by authority (TRA89)
* The number of vehicles passing in 24 hours at an average point on the road network in each local authority. This controls for differing length of road in each authority, providing a measure of how heavily used the roads are.
It is calculated by dividing the estimate of annual vehicle miles (or km) in each local authority by the length of road in that authority and number of days in the year
Table 4 gives summary data of the emissions which have road transport as their source. We have calculated these by converting the NAEI data into a form that could be more easily analysed geographically. For the analysis we have used ESRI ArcGIS Pro and Tisler QGIS Geographic Information System software. A more detailed table with district results is available as a Microsoft Excel download.
High emissions of pollution from various sectors
Slide (or page) 2 of the Microsoft Power BI report on air pollution analyses the 1km squares with the highest emissions. This time we are showing all squares where emissions exceed 0.1 tonnes. This year we note the 32 tonnes of NOx from the Shadsworth Business Park in Blackburn. Also noted are the 111 tonnes of NOx from industrial sources at the Wigan Road / Dawson Lane junction in South Ribble.
Point source emissions
The major point sources are now also mapped in the same Microsoft Power BI report that shows the high area emissions mentioned above (slide 4). The Ribblesdale Cement Works near Clitheroe in Ribble Valley continues to be a major source of NOx and SO2. In 2024 there were 646 tonnes of NOx and 258 tonnes of SO2 directly attributed to the works. The full list is available on the NAEI website.
Air quality in Lancashire results from the 2025 English indices of deprivation
Introduction
This article considers air quality and emission results for the Lancashire 14-authority area. This encompasses the 12-districts that are within the Lancashire County Council area, and the two unitary authorities of Blackburn with Darwen and Blackpool.
A combined indicator of air quality for small local areas was developed as part of the English Indices of Deprivation and the results are available for the 945 lower super output area level (LSOAs) in the Lancashire-14 area. The air quality indicator is one of the sub-indicators that forms part of the living environment deprivation domain.
The air quality indicator is a modelled estimate of the concentration of the four pollutants: nitrogen dioxide, benzene, sulphur dioxide and particulates. Air quality data for 2023 on a 1km grid were obtained from the UK Air Information Resource. For each pollutant, the atmospheric concentration is related to a guideline or standard value. For the 2025 IoD, this standard is the WHO guideline, which we also use for the background concentrations section. Please see DEFRA website for details of various air pollutants.
The index values for the four pollutants were derived from the estimate standardised against the WHO values, then summed to create an overall air quality index score for the LSOA. The combined air quality figure which represents the overall quality score or ratio for each LSOA is derived simply by the addition of the scores for each of the four pollutants. A higher value implies a poorer overall air quality though there is no stated value above which the Combined Air Quality Indicator itself is said to indicate an unsafe concentration of pollutants. Nationally the indicator falls into the range 0.92 to 5.72.
The Lancashire Results
Many urban areas in Lancashire suffer to some degree from poorer air quality than other parts of the county though it is clearly much less of an issue in the coastal towns of Lancaster/Morecambe, Fleetwood, Lytham St Annes and Blackpool, presumably due in part to the direction of the prevailing winds.
Figure 1. Combined Air Quality Indicator (2025 Index of Deprivation)
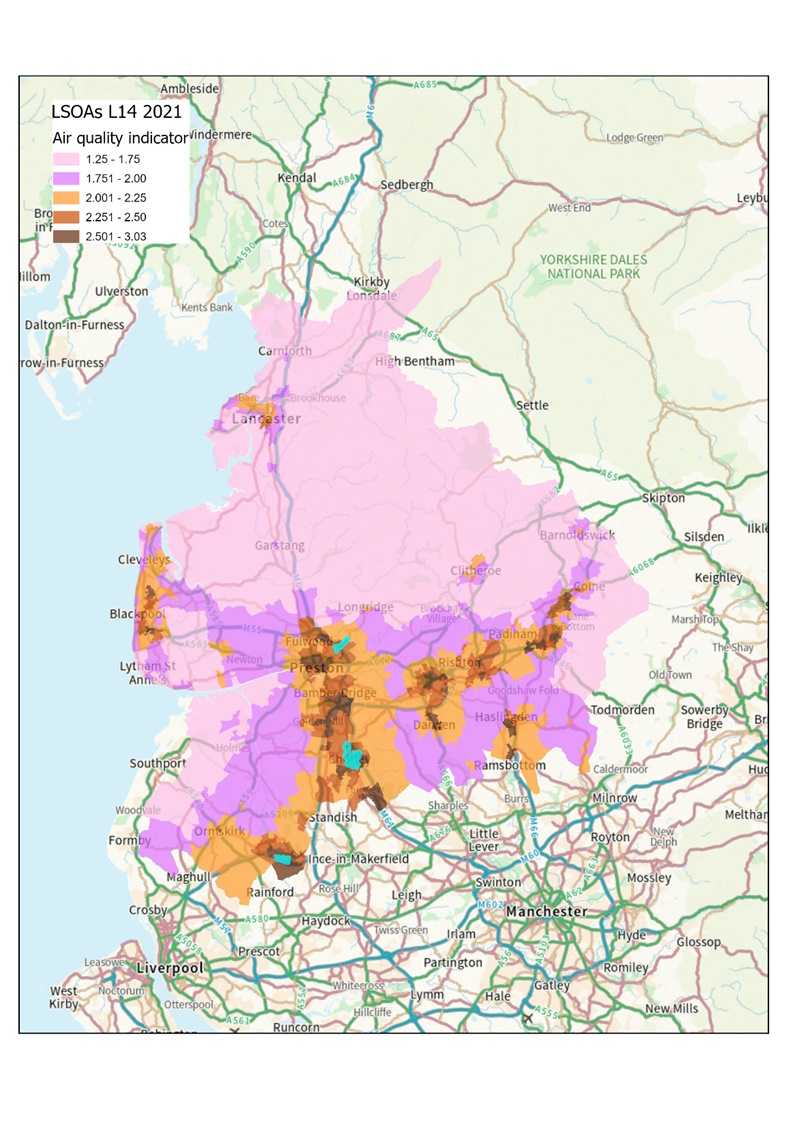
Most Lancashire areas recorded good overall air quality results. Changes in methodology makes comparisons between indices from different periods difficult to interpret. The highest recorded score in Lancashire (3.03), which occurs in two adjoining LSOAs in West Lancashire is considerably less than the worst level recorded in the country (5.72). No areas of Lancashire experience air pollution levels anything like those recorded in the centres of London and other larger cities. More than 200 LSOAs with the highest indicator scores all are in London, of which 7 LSOAs in Camden occupy places in the top 12 including the top 2 ranks. The other five in the top dozen are located in the City of London and Westminster. Only beginning at rank =213 do we see any LSOAs in other parts of the country, in this case an LSOA in Spelthorne in Surrey, a district neighbouring Heathrow Airport.
There are some parts of the county where the figures are not encouraging but the combined air quality Indicator reveals that out of 33,755 LSOAs in England, the worst performing Lancashire LSOAs were in =7,544th place.
Of the 12 LSOAs with the highest air quality indicator scores (above 2.84) in the Lancashire-14 area, two in West Lancashire have scores exceeding 3. These are in the Digmoor area and border the M58 motorway. The next highest (2.91) is in Preston, an area covering Red Scar and straddling the M6 motorway. The fourth highest at 2.89 is an LSOA that adjoins the first two in West Lancashire, enclosed by the M58, junction 5 on the M58 and the A577. The next 8 cover the west and southeast of Chorley town centre. This pattern is entirely different from what was seen in 2019. There are 29 LSOAs with air quality indicator scores below 1.58 in Lancaster, Ribble Valley, Wyre and Pendle. They cover much of the northern part of the county, but not the Lancaster and Morecambe urban area. Those with the best scores, 1.25 or 1.29, are large LSOAs in the rural north-east of the county.